Algo-Model
MetaboGuard Results and Terminology Guide
Current status
MetaboGuard has a valid self-supervised representation/deviation artifact, but does not currently have a validated future cancer or diabetes risk model.
The current artifact may be used to:
- generate latent metabolic representations;
- calculate deviation percentiles;
- identify measurements contributing to reconstruction deviation;
- benchmark unsupervised tabular representations.
It must not be described as predicting future development from current NHANES data.
Self-supervised artifact
| Item | Result |
|---|---|
| Unlabelled training rows | 50,000 |
| Raw features | 25 |
| Latent dimensions | 16 |
| Validation reconstruction loss | 0.0565 |
Post-hoc cross-sectional association checks:
| Label | AUROC | AUPRC | Interpretation |
|---|---|---|---|
| Any-cancer prevalence | 0.699 | 0.169 | Representation association only |
| Type 2 diabetes proxy | 0.923 | 0.675 | Current-state association only |
| Type 1 proxy | 0.909 | 0.135 | Unvalidated research proxy |
These values are not development-risk performance.
Pancreatic model invalidation
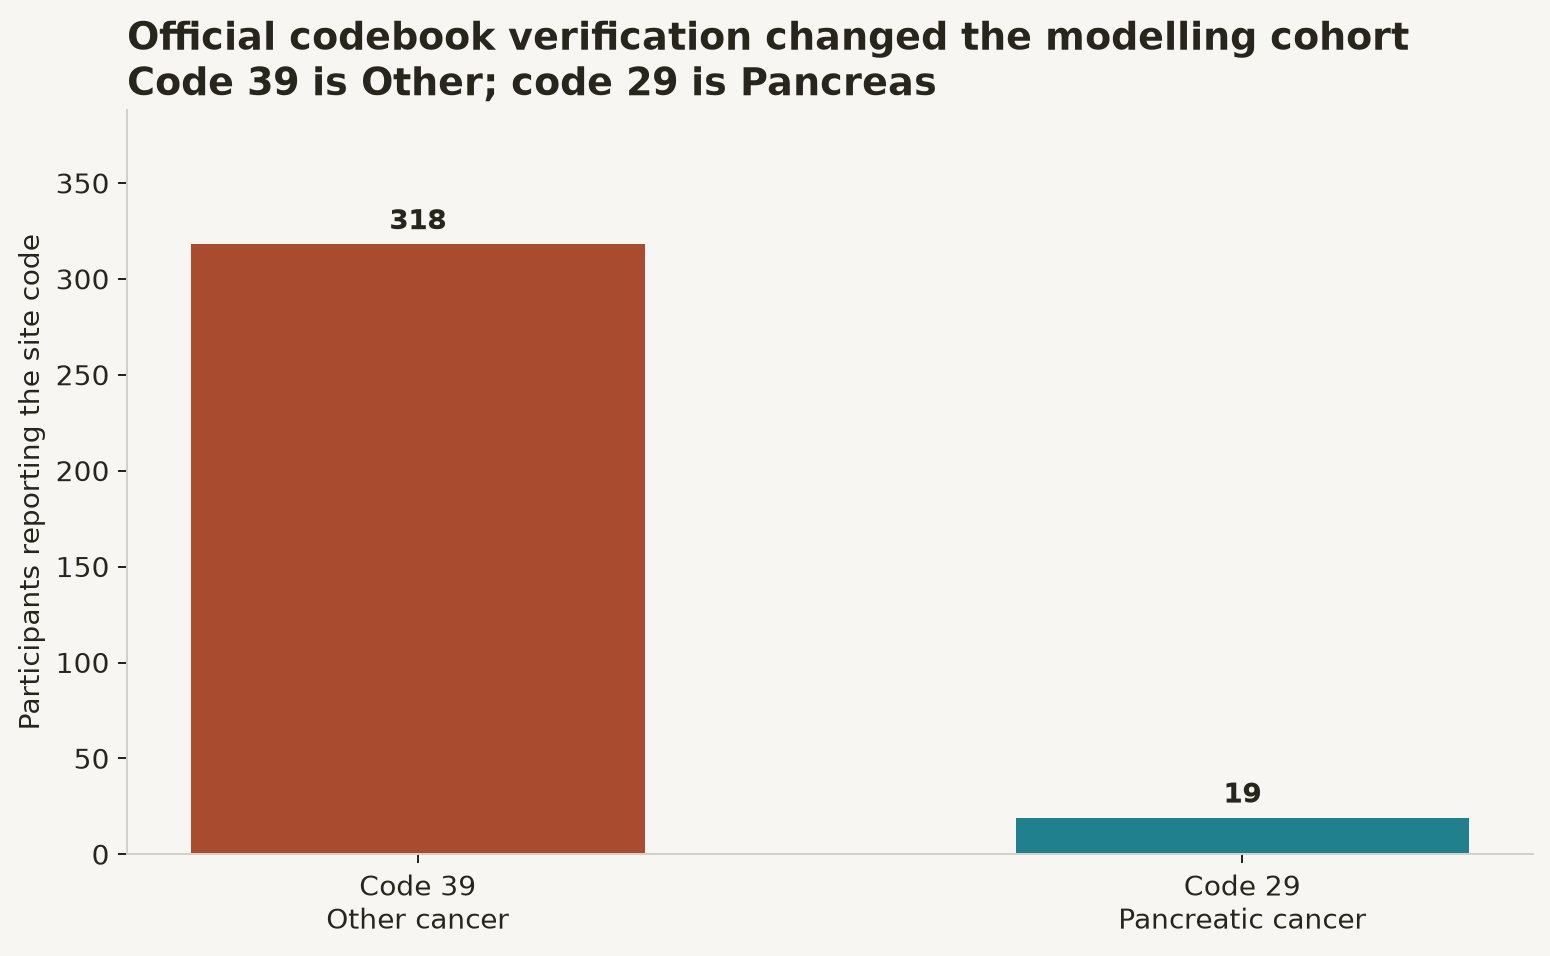
An audit against the official NHANES codebook found that the first pooled dataset used MCQ230 code 39 as pancreatic cancer. The official coding is:
- 29 = Pancreas (pancreatic)
- 39 = Other
The former metrics and MetaboGuard-XGB v1 artifact are invalid and must not be
quoted, benchmarked, published or used for inference.
Corrected cohort
The corrected nhanes_multicycle_v2.csv contains:
| Definition | Positive cases |
|---|---|
| Pancreatic cancer across the pooled population | 19 |
| Pancreatic cancer among participants with diabetes | 7 |
| Usable diabetic positives after required-field cleaning | 6 |
| Pancreatic cancer diagnosed 0-3 years after diabetes | 2 |
These event counts are too small for train/test splitting, calibration, temporal validation or model comparison.

Safety behaviour
MetaboGuard now:
- Excludes
nhanes_multicycle.csvandnhanes_merged.csvfrom API discovery. - Uses the versioned corrected datasets ending in
_v2.csv. - Requires at least 20 usable positive and 20 usable negative cases.
- Stores a SHA-256 dataset signature in every new artifact.
- Retrains or refuses inference when the dataset signature changes.
- Blocks public model export when the corrected cohort is underpowered.
Priority A variables now available
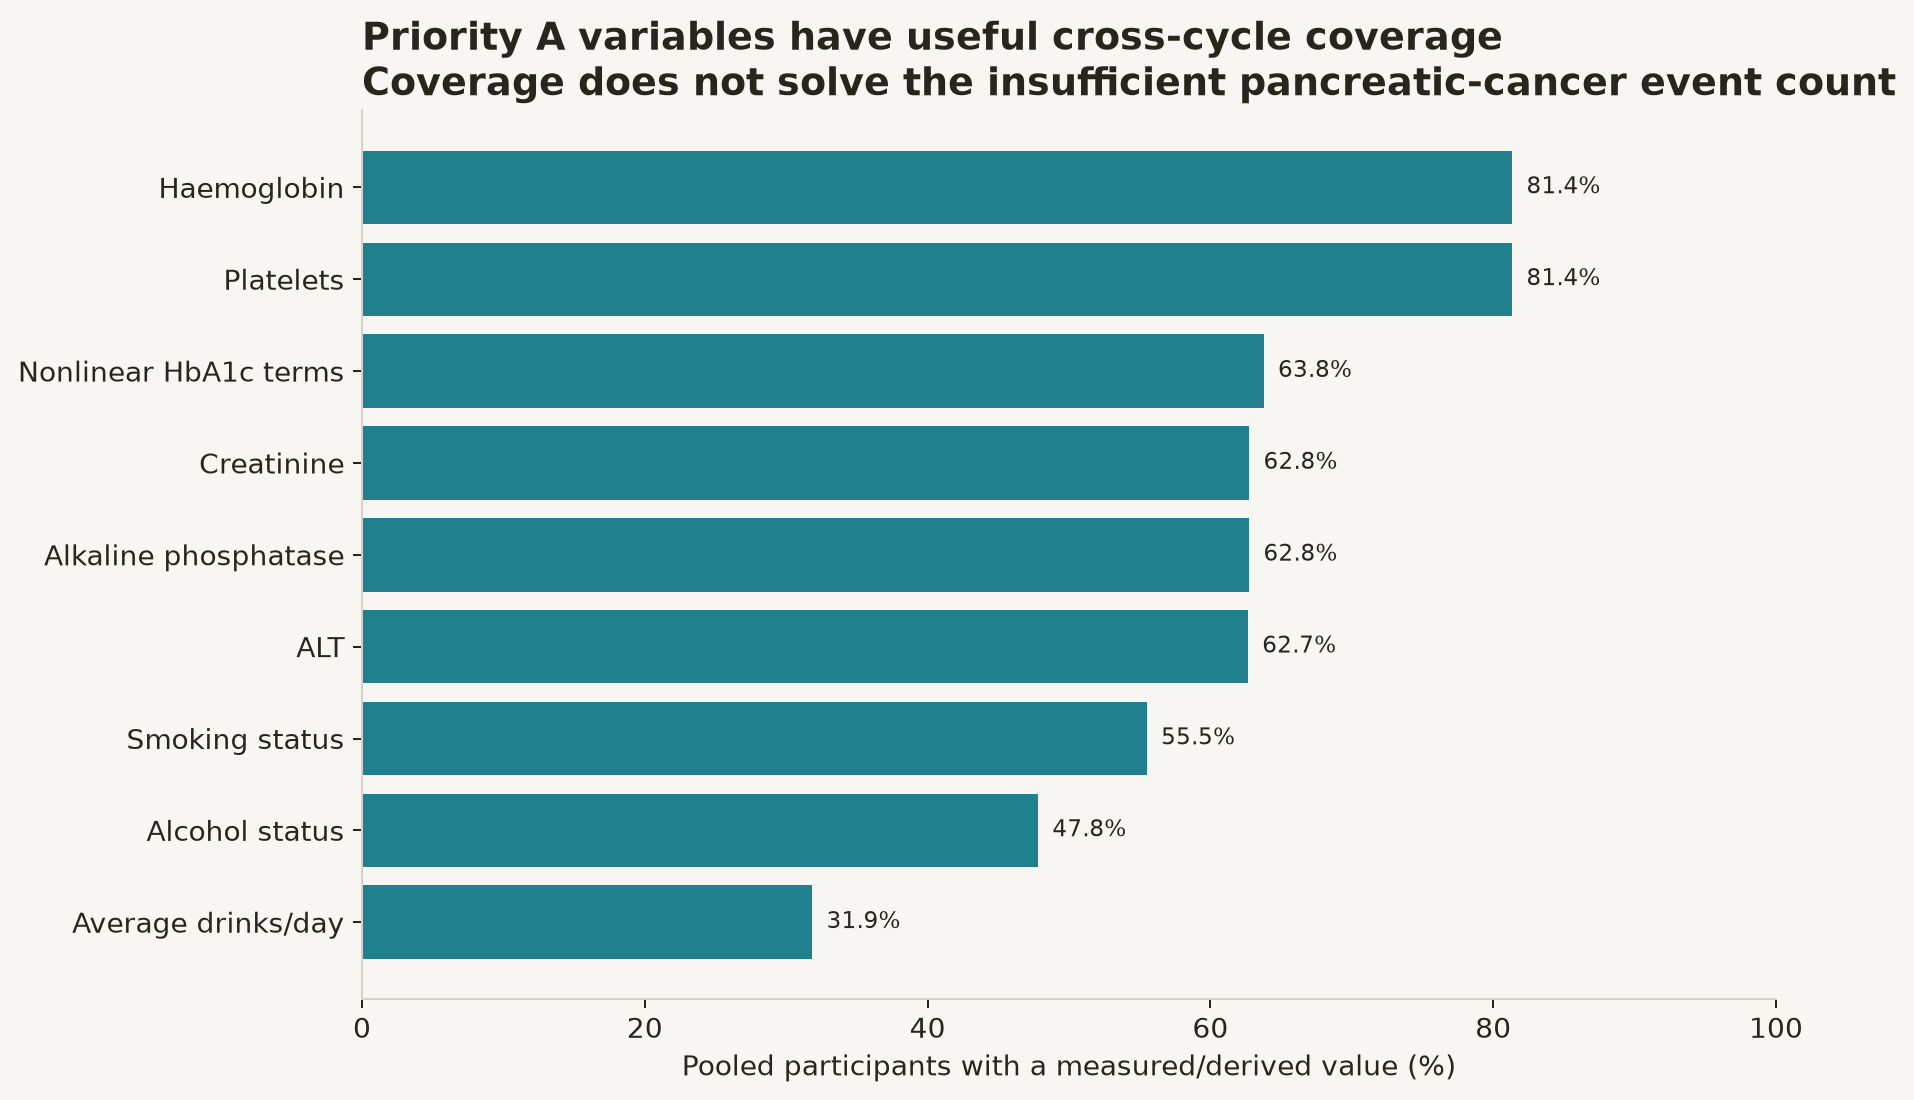
| Variable | MetaboGuard field | Coverage in pooled cohort |
|---|---|---|
| Smoking status | smoking_status |
59,745 |
| Current smoker | current_smoker |
59,745 |
| Alcohol status | alcohol_status |
51,467 |
| Average drinks/day | average_drinks_per_day |
34,282 |
| Haemoglobin | CBC_LBXHGB |
87,554 |
| Platelet count | CBC_LBXPLTSI |
87,552 |
| ALT | BIOPRO_LBXSATSI |
67,442 |
| Alkaline phosphatase | BIOPRO_LBXSAPSI |
67,536 |
| Creatinine | BIOPRO_LBXSCR |
67,542 |
| Reciprocal HbA1c term | hba1c_reciprocal_100 |
68,644 |
| Squared HbA1c term | hba1c_squared |
68,644 |
These variables improve the feature schema but cannot compensate for only six usable positive diabetic pancreatic-cancer cases.
Is higher better?
| Output | Meaning | Direction |
|---|---|---|
| AUROC | Ranking discrimination | Higher is better; 0.5 is random |
| AUPRC | Precision-recall performance | Higher is better; compare with prevalence |
| AUPRC lift | AUPRC divided by prevalence | Higher is better; 1× is baseline |
| Brier score | Squared probability error | Lower is better |
| Feature importance | Model dependence on a feature | Larger means more influence, not causality |
No corrected pancreatic-risk values are currently reported for these metrics.
What is still valid
- TCGA-CDR prognosis experiments remain separate and are unaffected by the NHANES site-code correction.
- NHANES diabetes and any-cancer descriptive analyses remain available.
- The corrected v2 datasets and variable-coverage audit are valid.
- The paper-derived genetic, protein and metabolite candidate catalogues remain valid research inputs.
Required next dataset
The brief requires a cohort containing:
- a sufficiently large incident pancreatic-cancer endpoint;
- exact diabetes and cancer diagnosis dates;
- at least 20 positive cases for exploratory fitting, preferably far more;
- repeated HbA1c, glucose, BMI and weight measurements;
- smoking and routine blood tests;
- ideally genotype, CA19-9 and/or the prioritised serum proteins.
UK Biobank or an equivalent linked clinical/genetic cohort is required for the primary MetaboGuard model. NHANES should remain a feature-engineering and population-context dataset.
How to read each output (2026-08-04 terminology contract)
| Output | What it is | What it is not | Safe sentence |
|---|---|---|---|
metabolic_deviation_score |
Distance of a profile from the training reference (0.7 × reconstruction + 0.3 × latent distance, both robust-scaled) | A probability, a severity grade, or a diagnosis | “This profile is unusual relative to our reference sample.” |
reference_percentile |
Rank of that score inside the training reference distribution | A population percentile (survey weights are not applied) | “It sits above the 95th percentile of our training reference.” |
latent_representation |
16 learned numbers summarising the inputs | Interpretable biology; individual dimensions have no assigned meaning | “It is the encoding we use for downstream research.” |
top_deviation_features |
Features contributing most to reconstruction error | Causes, or clinically abnormal values | “Most of the unusualness comes from HbA1c and triglycerides.” |
cross_sectional_association_probability |
Probability that someone with this profile already has a recorded diagnosis in NHANES | A future-risk probability; a screening result | “Profiles like this are more common among people who already report a diagnosis.” |
| Post-hoc AUROC / AUPRC | Separation of prevalent cases on the holdout partition | Prevention or early-warning performance | “The representation carries cross-sectional signal.” |
| Baseline reconstruction MSE | How well an unsupervised method models the feature distribution | Disease prediction skill | “The encoder models the data slightly better than a matched PCA.” |
| Flag Jaccard between methods | Overlap of the top-5 % most-unusual profiles | Agreement about disease | “Which profiles look unusual depends on the method, so clinicians adjudicate.” |
Deprecated: cancer_risk_probability is retained for one release as an alias of
cross_sectional_association_probability. Do not quote it; the name implies future
risk the data cannot support.
Reading the research-pass outputs (added 2026-08-04)
Feature eligibility tiers (data observation)
| Tier | What it means for interpretation |
|---|---|
usable_now |
Present, plausible, ≥50% coverage among adults, no blocking drift or availability gap. |
qualified_use |
Usable with the stated caveat printed alongside any result: low coverage, cycle availability gap, cycle-level drift, implausible-value burden, or a declared evidence gap. |
unavailable |
Absent or effectively unmeasured. Any statement about it is unsupported. |
prohibited |
Outcome label, label-derived column, or post-diagnosis TCGA context. Never an input. |
Current file: 17 usable_now, 8 qualified_use (C-peptide, glucose, insulin, hs-CRP,
triglycerides, LDL, HOMA-IR, race/ethnicity), 0 unavailable, 16 prohibited.
Cluster outputs (model association)
| Output | What it is | What it is not |
|---|---|---|
cluster_id |
A phenotype identifier such as cluster_2 |
A cancer type, cancer site, disease subtype or severity grade |
prototype_median_profile |
Median raw feature values inside the phenotype | A patient, a reference range or a target |
top_distinguishing_panel |
Features whose robust standardised difference from the reference is largest | Causes, or evidence that the panel detects disease |
membership_confidence |
GMM posterior, or k-means relative margin | A probability of disease |
posthoc_label_summary |
Prevalence of an already-recorded diagnosis per phenotype, suppressed below 50 cases | Future risk, incidence, or validation of the phenotype |
status: no_stable_clusters |
A result: nothing passed the gates | A bug, or a reason to lower the thresholds |
If the status is no_stable_clusters, the correct sentence is: “No stable metabolic
phenotype survived our stability and negative-control checks on this data.” Do not describe
candidate solutions from the table as findings.
Negative controls
A gating control above 0.30 means the clustering largely reproduces that nuisance variable. Age and sex associations are expected to be non-zero in metabolic data; only values above the threshold mark a solution as a data artefact. The exact assay-availability pattern is shown for transparency and never gates a decision.
Evidence rows (published evidence)
Read three fields together before quoting any number: stage_or_lead_time,
validation_status and limitations. A high AUC measured at diagnosis says nothing about
early detection; the lead-time column is where the honest answer lives. Rows without a
source URL or with an ungraded evidence_grade are research-only and must not reach a
clinician-facing surface. See EVIDENCE_AND_CLAIMS.md for the
allowed and denied statement lists.
Gated off entirely: any 1/3/5-year horizon output. /api/v1/prevention-future-risk
returns HTTP 409 with the event-count gate report, and
prevention-capabilities.longitudinal_heads_enabled is false.
Professor assessment payload format (2026-08-05)
Professor-facing API/UI surfaces now render a shared envelope so interpretation is explicit and consistent:
current_profile_assessment: current-state meaning (deviation band or cross-sectional association framing).standout_factors: feature-level contributions for this profile.data_readiness: missing inputs with priority and rationale.research_association: prevalence/proxy-only status text.safety_contract:diagnostic_status=non_diagnostic,future_risk=disabled.
Example reading patterns
- Within reference range: “Current profile assessment shows within-reference-range deviation. No model warning; still not evidence that disease is absent.”
- Elevated deviation with missing key data: “Deviation is elevated, and data readiness lists missing high-impact fields before deeper interpretation.”
- High deviation with risk-disabled behavior:
“Profile is highly unusual, but future-risk and cancer-type outputs remain
disabled on cross-sectional capability state.”
Future-risk rows (simulation only)
The dashboard’s future-risk panel shows one row per horizon (1, 3 and 5 years). Every row is one of exactly two things:
- A simulated calibrated estimate — cumulative incidence from a simulation-only artefact, shown alongside the raw uncalibrated value and the selected model name. It is synthetic. It is not a patient’s risk, not a diagnosis and not evidence of early detection.
- An explicit abstention — the horizon did not pass the 50-event / 50-non-event gate, so no number is produced. Abstention is a result, not a failure to load.
Reading the numbers:
- Calibrated vs raw: calibration is fitted on a synthetic validation split. Absolute values are not population-calibrated when the cohort used declared enrichment strata.
- Competing outcomes: incidence is cause-specific with death treated as a competing event, so the target-outcome curve does not absorb deaths.
- Uncertainty: bootstrap confidence intervals, calibration slope/intercept, Brier, average
precision, subgroup metrics and negative controls live in the run artefact’s
results.json— not per individual synthetic history. - Real patients: the clinical future-risk endpoint returns HTTP 409. The panel states this.
The dashboard’s future-risk panel shows one row per horizon (1, 3 and 5 years). Every row is one of exactly two things:
- A simulated calibrated estimate — cumulative incidence from a simulation-only artefact, shown alongside the raw uncalibrated value and the selected model name. It is synthetic. It is not a patient’s risk, not a diagnosis and not evidence of early detection.
- An explicit abstention — the horizon did not pass the 50-event / 50-non-event gate, so no number is produced. Abstention is a result, not a failure to load.
Reading the numbers:
- Calibrated vs raw: calibration is fitted on a synthetic validation split. Absolute values are not population-calibrated when the cohort used declared enrichment strata.
- Competing outcomes: incidence is cause-specific with death treated as a competing event, so the target-outcome curve does not absorb deaths.
- Uncertainty: bootstrap confidence intervals, calibration slope/intercept, Brier, average
precision, subgroup metrics and negative controls live in the run artefact’s
results.json— not per individual synthetic history. - Real patients: the clinical future-risk endpoint returns HTTP 409. The panel states this.
The dashboard’s future-risk panel shows one row per horizon (1, 3 and 5 years). Every row is one of exactly two things:
- A simulated calibrated estimate — cumulative incidence from a simulation-only artefact, shown alongside the raw uncalibrated value and the selected model name. It is synthetic. It is not a patient’s risk, not a diagnosis and not evidence of early detection.
- An explicit abstention — the horizon did not pass the 50-event / 50-non-event gate, so no number is produced. Abstention is a result, not a failure to load.
Reading the numbers:
- Calibrated vs raw: calibration is fitted on a synthetic validation split. Absolute values are not population-calibrated when the cohort used declared enrichment strata.
- Competing outcomes: incidence is cause-specific with death treated as a competing event, so the target-outcome curve does not absorb deaths.
- Uncertainty: bootstrap confidence intervals, calibration slope/intercept, Brier, average
precision, subgroup metrics and negative controls live in the run artefact’s
results.json— not per individual synthetic history. - Real patients: the clinical future-risk endpoint returns HTTP 409. The panel states this.